
Solana (SOL) Price: What the Charts Indicate After SOL Falls Below $80
TLDR
- SOL fell below $80, reaching a low of $77.30 following an inability to maintain levels above $95
- A bearish trend line is emerging with resistance at $82 on the hourly chart
- The long-to-short ratio stands at 0.89, suggesting more traders are betting on further price drops
- Funding rates have turned negative at -0.0245%, a level last seen during the February 6 price decline
- Should SOL break below $76.45, the next key target is the February 6 low of $67.50
Solana has declined by more than 6% and is now trading below $80, prolonging a losing streak that dates back six weeks to mid-January.

The downward movement began after SOL failed to hold above $95. It then breached the $90 and $85 support levels before hitting a low of $77.30.
As of the time of writing, SOL is trading around $76.45, the lower limit of its current consolidation range.
The price is trading below the 100-hour simple moving average, reinforcing the bearish outlook.
On the hourly chart, a bearish trend line has emerged with resistance at $82. The 50% Fibonacci retracement level of the recent swing also aligns near $82, marking this as a critical zone to monitor.
For a recovery to take hold, bulls would need to drive the price back above $82 and then $83.10. A clear close above $83.10 could pave the way for a move toward $87 and ultimately $92.
Derivatives Data Turns Bearish
The derivatives market is supporting the downward scenario. Data from CoinGlass shows SOL’s long-to-short ratio stands at 0.89, close to its lowest level in more than a month. A ratio below 1 indicates more traders are positioned for the price to drop.
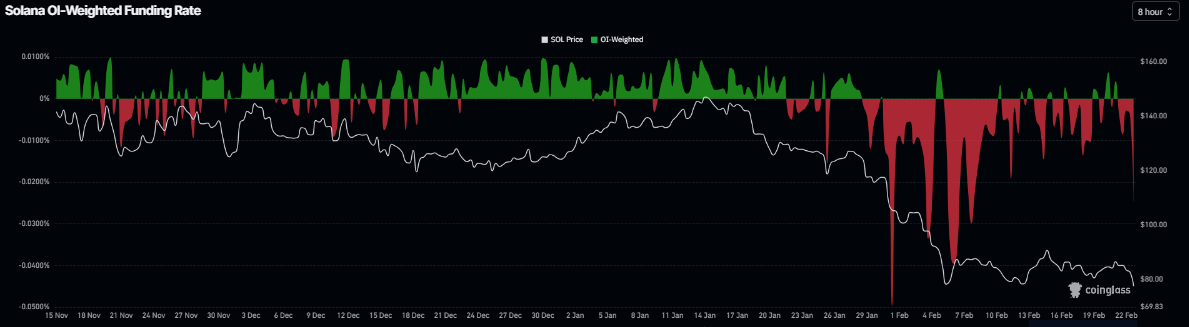
Funding rates have also turned negative. SOL’s current funding rate is -0.0245%, a level last observed during the February 6 price decline. Negative funding implies short traders are compensating long traders, reflecting a market with a strong bearish bias.
The RSI is at 31, trending downward and nearing oversold levels. The MACD lines are converging, indicating indecision among traders.
Key Levels to Watch
If SOL fails to hold $76.45 on a daily close, the next significant downside target is the February 6 low of $67.50.
This could very likely be the bottom zone for this cycle.
Where do you think Solana will bottom?
— Ted (@TedPillows)
Below that, the $62 level has been identified as additional support.
On the upside, $77 is the first resistance zone, followed by $82, $83.10, and $87.
SOL has now recorded losses for six consecutive weeks since mid-January.
The February 6 low of $67.50 remains the key level analysts are monitoring if selling pressure persists.