
Solana (SOL) Price: Buyers Emerge at Key Support as ETF Investors Increase Holdings
TLDR
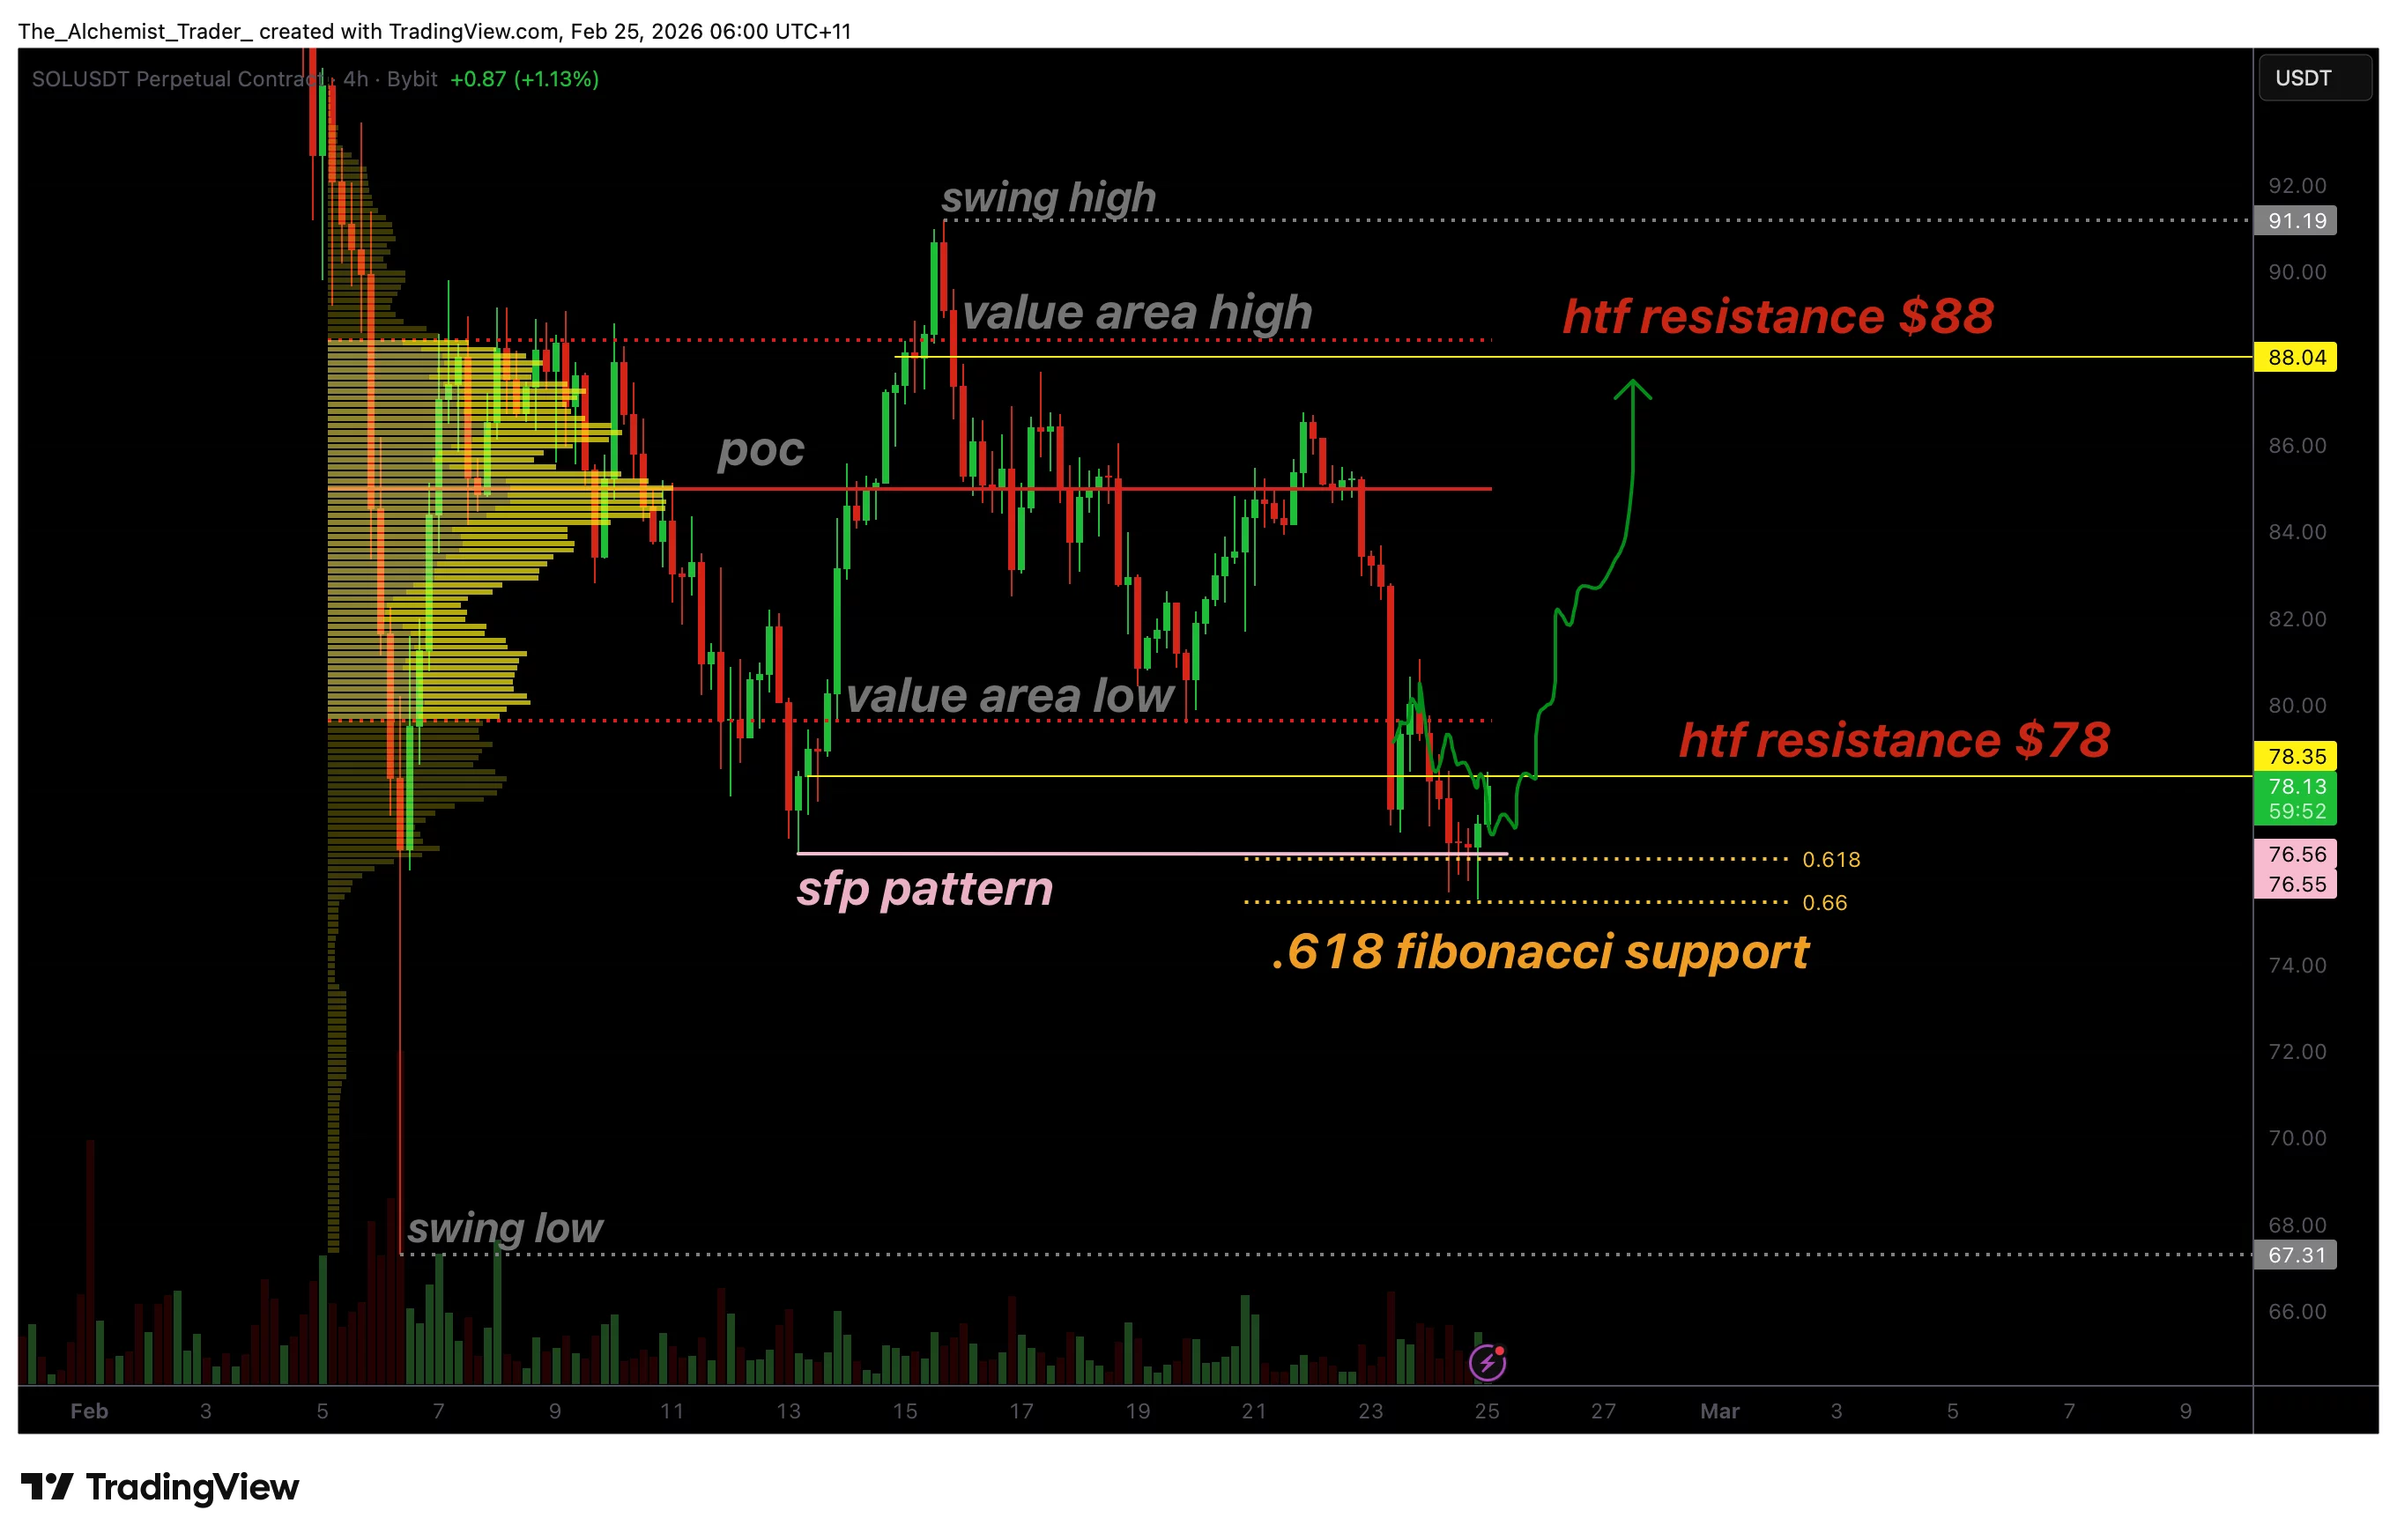
- Solana (SOL) is currently trading near $80, having rebounded from a low of $75.64.
- A swing failure pattern (SFP) has emerged at the 0.618 Fibonacci support, indicating a possible short-term price reversal.
- Crucial resistance levels to monitor include $82, $84, and $85, with $92 and $95 identified as subsequent upside objectives.
- Regaining the $78–$82 range is essential to validate any bullish price formation.
- Bitwise’s BSOL staking ETF attracted over $3 million in new investments on February 23, despite SOL’s price having fallen approximately 41% over the past three months.
Solana is showing signs of recovery after its price fell to $75.64. It has since risen above $80 and is currently trading above its 100-hourly simple moving average.

This upward movement occurred after SOL surpassed a bearish trend line that had previously acted as resistance at $81 on the hourly chart.
Furthermore, SOL moved past the 50% Fibonacci retracement level of its decline from $86.68 to $75.64, which is a moderately positive indicator for immediate price trends.
Sellers remain active around $82.50, a point that coincides with the 61.8% Fibonacci retracement level. This area represents the next significant challenge for buyers.
A swing failure pattern (SFP) has developed at the 0.618 Fibonacci support. This pattern involves the price briefly dipping below a previous low, triggering stop-loss orders, and then rapidly reversing upwards.
Several downside wicks on the chart indicate that while sellers attempted to drive the price down, they were unable to sustain the lower levels. Buyers intervened, absorbing the selling pressure.
This formation is interpreted as a potential signal that a local price bottom is establishing, although further confirmation is required.
$78 Is the Key Level to Watch
For the recovery to be considered credible, SOL must regain and maintain a position above $78. This level is viewed as local resistance and a pivotal point for its near-term trajectory.
(per request)
2 clear scenarios as far as I’m concerned.
Needs to close daily back above $80 to activate bullish (orange) scenario.
— Nebraskangooner (@Nebraskangooner)
Sustaining above $78 would also place SOL above the value area low, a metric utilized in volume analysis to assess buyer engagement.
Should $78 be sustained, the subsequent upside target is $88. This level corresponds with previous distribution zones and would signify a substantial rebound from present prices.
Further upward, resistance points are found at $92 and then $95. However, a close above $85 would first be necessary to access these higher levels.
BSOL ETF Sees Inflows Despite Price Drop
From an institutional perspective, Bitwise’s Staking ETF (BSOL) registered net inflows totaling $3,048,570 on February 23, 2026.
This increased the fund’s total assets under management to $490,255,220. The single-day inflow accounted for approximately 0.62% of its AUM.
This occurred even though SOL had declined by roughly 41% over the preceding three months. At that time, the short-term technical indicator for SOL-USD was signaling a Strong Sell.
Should SOL not manage to surpass $82, initial downside support levels are at $80, followed by $79. A breach below $79 could potentially push the price back towards $77 or even $74.
SOL was trading at $76.57 when the BSOL inflow report was issued on February 23.