
Bitcoin Price Analysis: Bulls Back in Charge as BTC Breakout Aims for $100K
TLDR
- A confirmed breakout from a falling wedge pattern for BTC points to a potential rise toward $100K–$105K, provided key support levels are maintained.
- The weekly chart structure stays bullish as long as the price holds above $80K, indicating that recent dips are likely corrections within a larger upward trend.
- An increase in trading volume validates the breakout, pointing to a resurgence of buying pressure after a period of consolidation.
- Significant liquidity pools around $88K and $92K indicate the potential for increased volatility and price swings driven by liquidations.
Bitcoin is demonstrating a return of bullish momentum as several technical indicators converge on both short-term and long-term charts. Market analysts highlight a confirmed breakout formation, a robust overarching structure, and specific liquidity concentrations that may fuel price swings. Current technical configurations suggest that potential gains reaching between $95,000 and $105,000 are becoming a central focus, assuming critical support levels hold.
Falling Wedge Breakout Signals Bitcoin Price Upside
Analyst CRYPTOWZRD notes that the daily Bitcoin chart has confirmed a breakout from a falling wedge pattern that developed from mid-2025. This pattern is characterized by successively lower highs and lower lows, coupled with weakening downward momentum, and is frequently a precursor to a trend reversal. The breach above the upper trendline, situated near $90,000, indicates growing buying interest after a phase of compression.
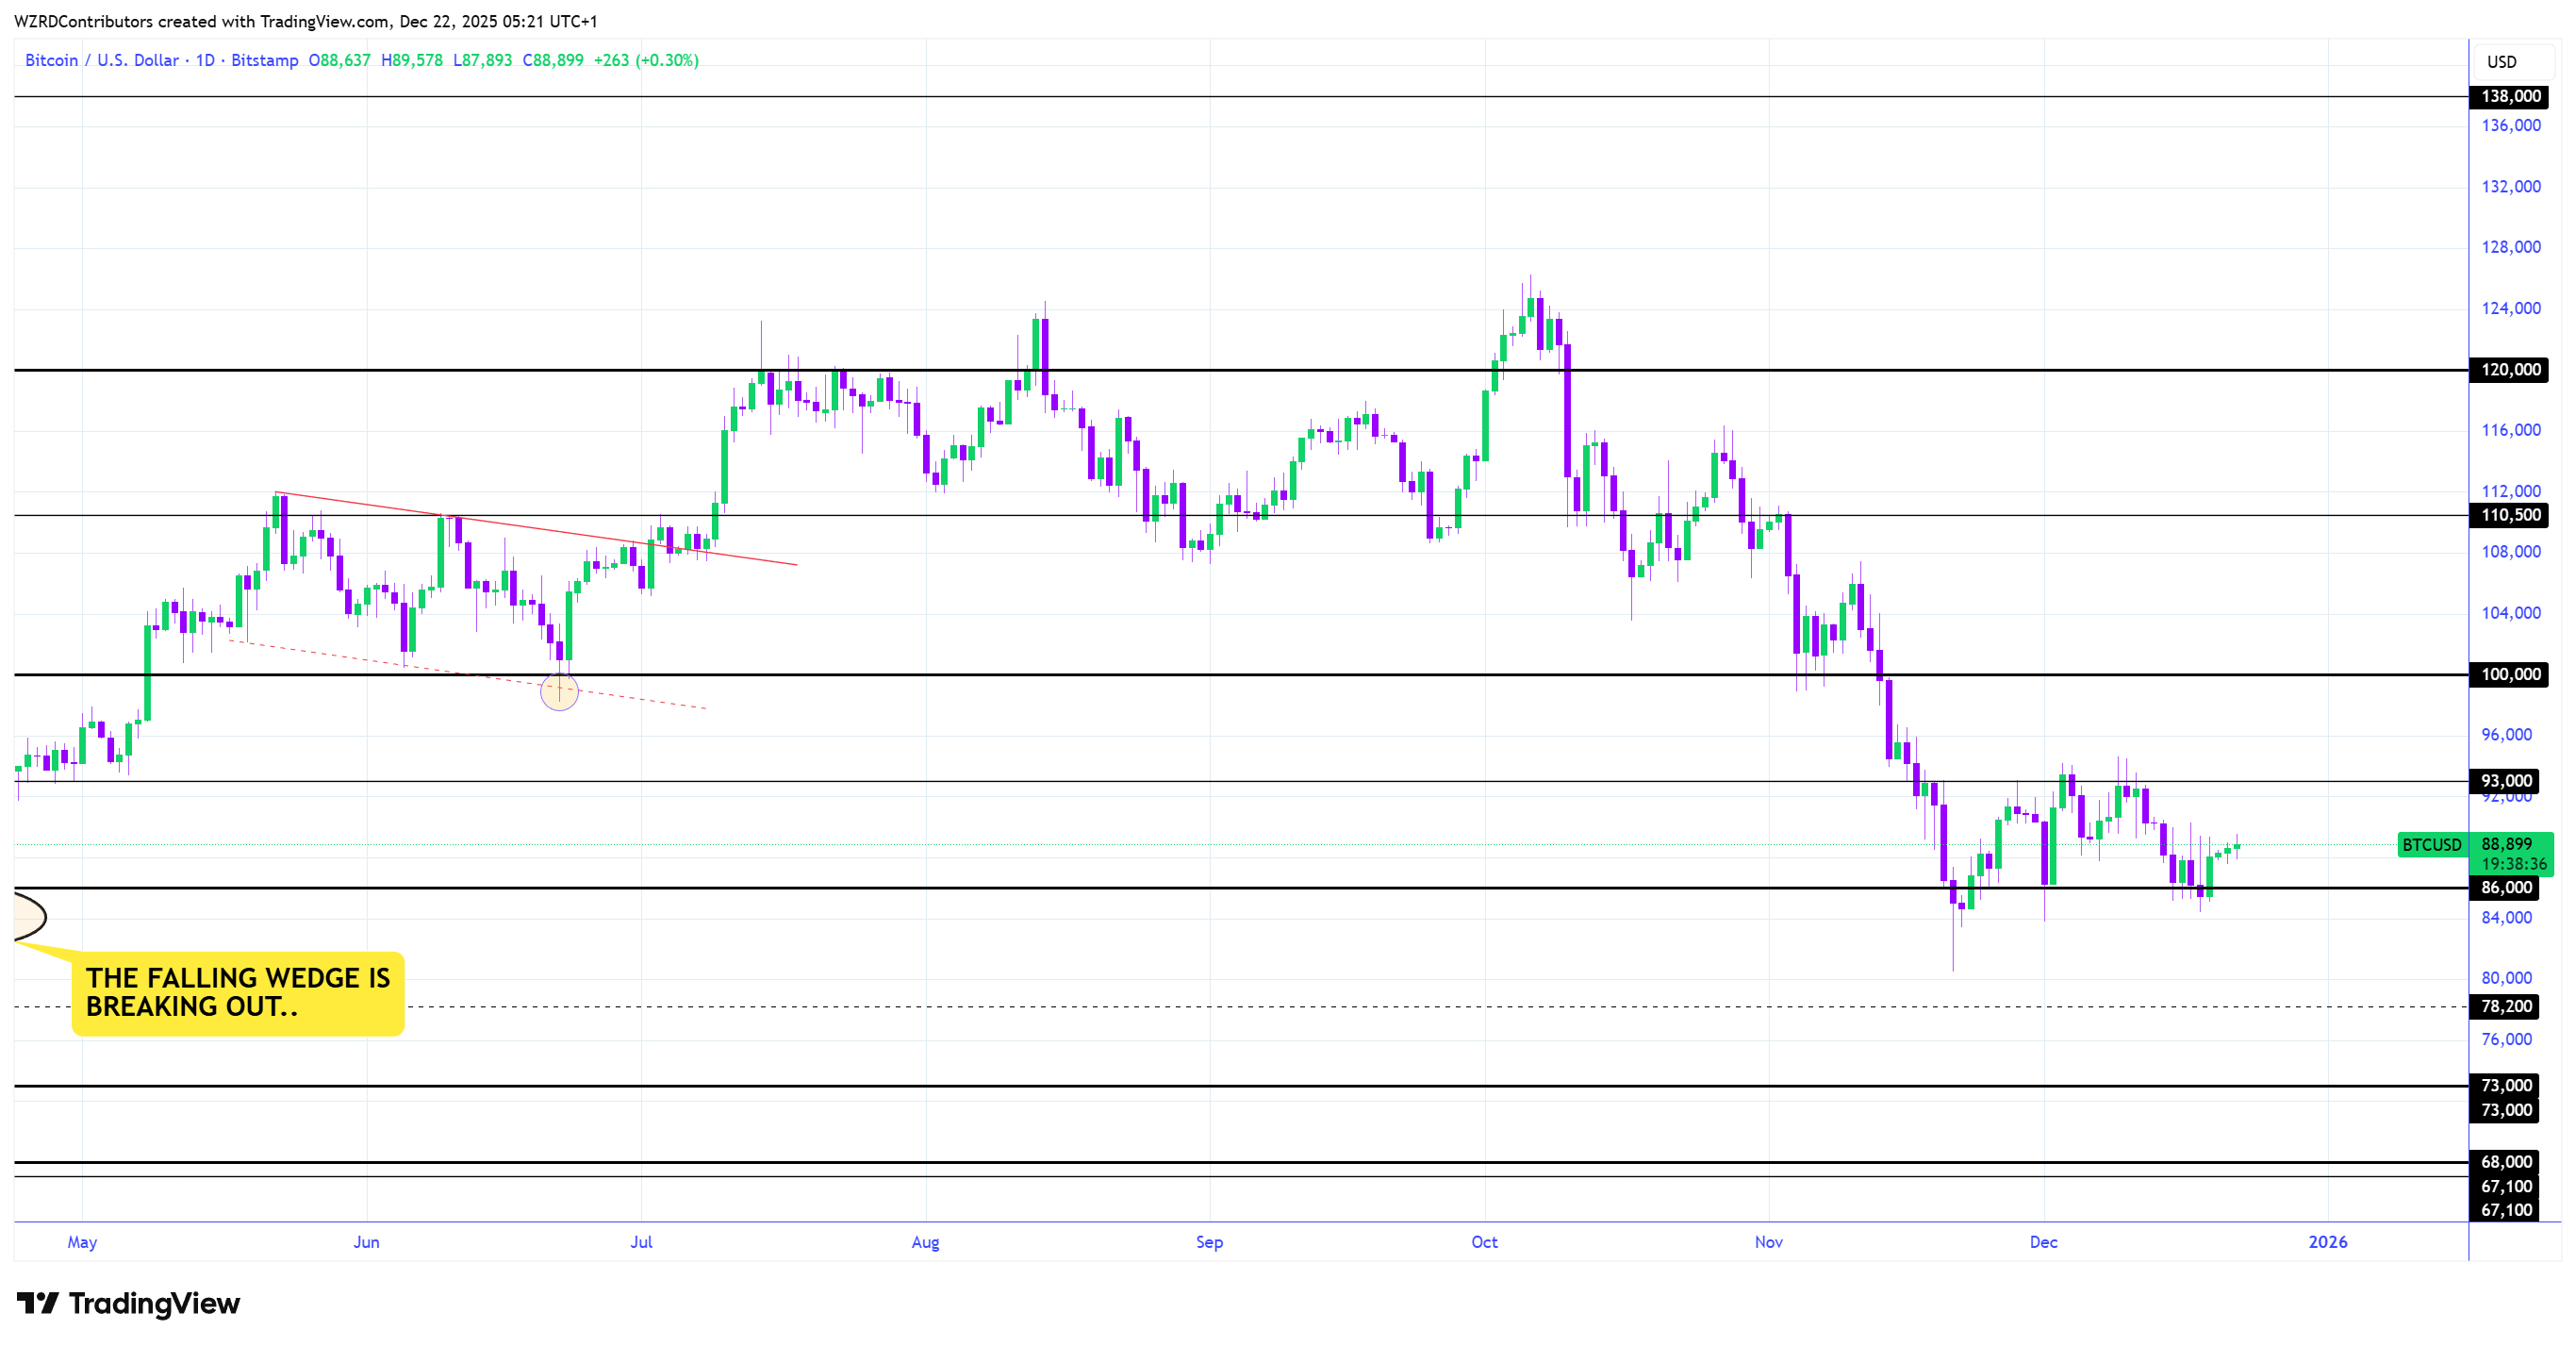
The volume profile also lends credibility to this move. Trading volume diminished as the wedge formed but subsequently increased as prices climbed, aligning with a typical bullish breakout scenario. With Bitcoin trading around $88,700, the breakout is considered intact provided the price stays above the $88,000 mark. Technical measurements based on the wedge’s height indicate a possible upward move into the $100,000–$105,000 range if the current momentum continues.
Weekly Trend Structure Remains Firm Above Key Support
Separately, analyst Jelle has emphasized the continued bullishness of the weekly chart structure. The long-term Bitcoin chart, spanning from 2023 to 2026, depicts a price advance within a sharply rising channel. Even with recent fluctuations, the pattern of higher lows remains unbroken, and the $80,000 level persists as a major structural support.
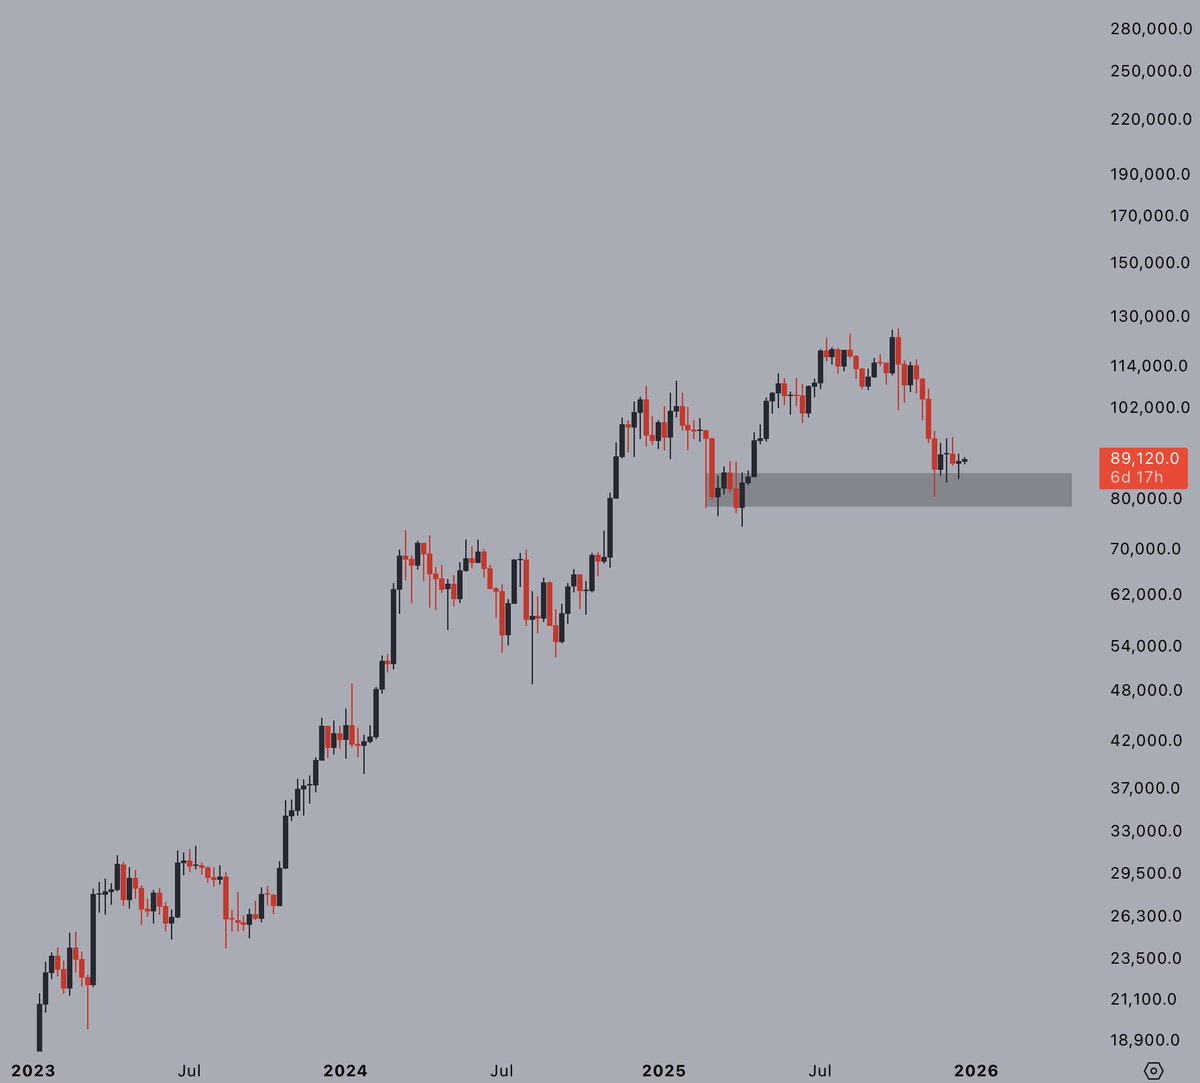
This analysis interprets the recent price decline as a correction within the market cycle, not a breakdown of the primary trend. Furthermore, volume has been consistent during upward moves, implying ongoing accumulation during price dips. The broader bullish outlook remains in place as long as Bitcoin stays above $80,000, with longer-term objectives pointing to the $110,000–$120,000 area in the subsequent phase.
Momentum indicators on the weekly chart also show no significant bearish divergence. History shows similar retracements occurred in past bull markets before the uptrend resumed. These factors support the interpretation that the current weakness is a temporary correction within a persistent uptrend.
It is important to note that a decisive break below the ascending channel’s support would invalidate this positive outlook and open the door to more substantial losses. Presently, however, the price action continues to respect the channel’s support level.
Liquidation Heatmap Flags Volatility Triggers Ahead
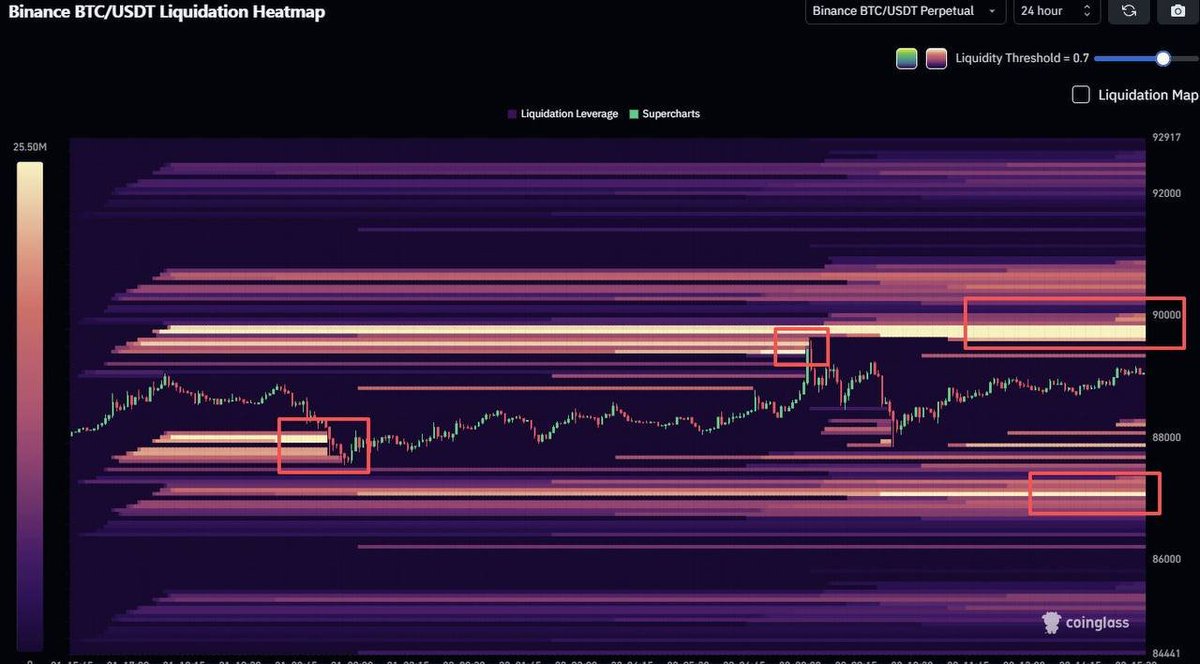
Adding to the analysis, a 24-hour liquidation heatmap from analyst Gerla identifies areas with elevated leverage risk. The data visualization reveals dense clusters of liquidity above $90,000 and below $88,000. These are price zones where a high concentration of stop-loss orders could lead to cascading liquidations, amplifying price movements.
A sustained price increase above $92,000 has the potential to trigger a short squeeze, possibly propelling Bitcoin toward $95,000. On the other hand, a decline below $88,000 could force out traders with leveraged long positions, pushing the price toward the $84,000 area. The relative lack of liquidity below $84,000 implies that any further decline might be contained if buyers step in to defend that support.
This data highlights a market positioned for a significant move rather than continued sideways action. The prevalence of overleveraged trades on both sides raises the probability of sharp price shifts once the asset breaks out of its current range. Until such a breakout happens, volatility is expected to stay high around these key liquidity levels.
In summary, the confluence of technical patterns, underlying trend strength, and market positioning data indicates that Bitcoin is at a critical point. At the time of writing, BTC is trading near $89,000, with immediate support at $88,000 and the next significant resistance level to watch at $95,000.